Chart Tool
A charting app for the modern newsroom
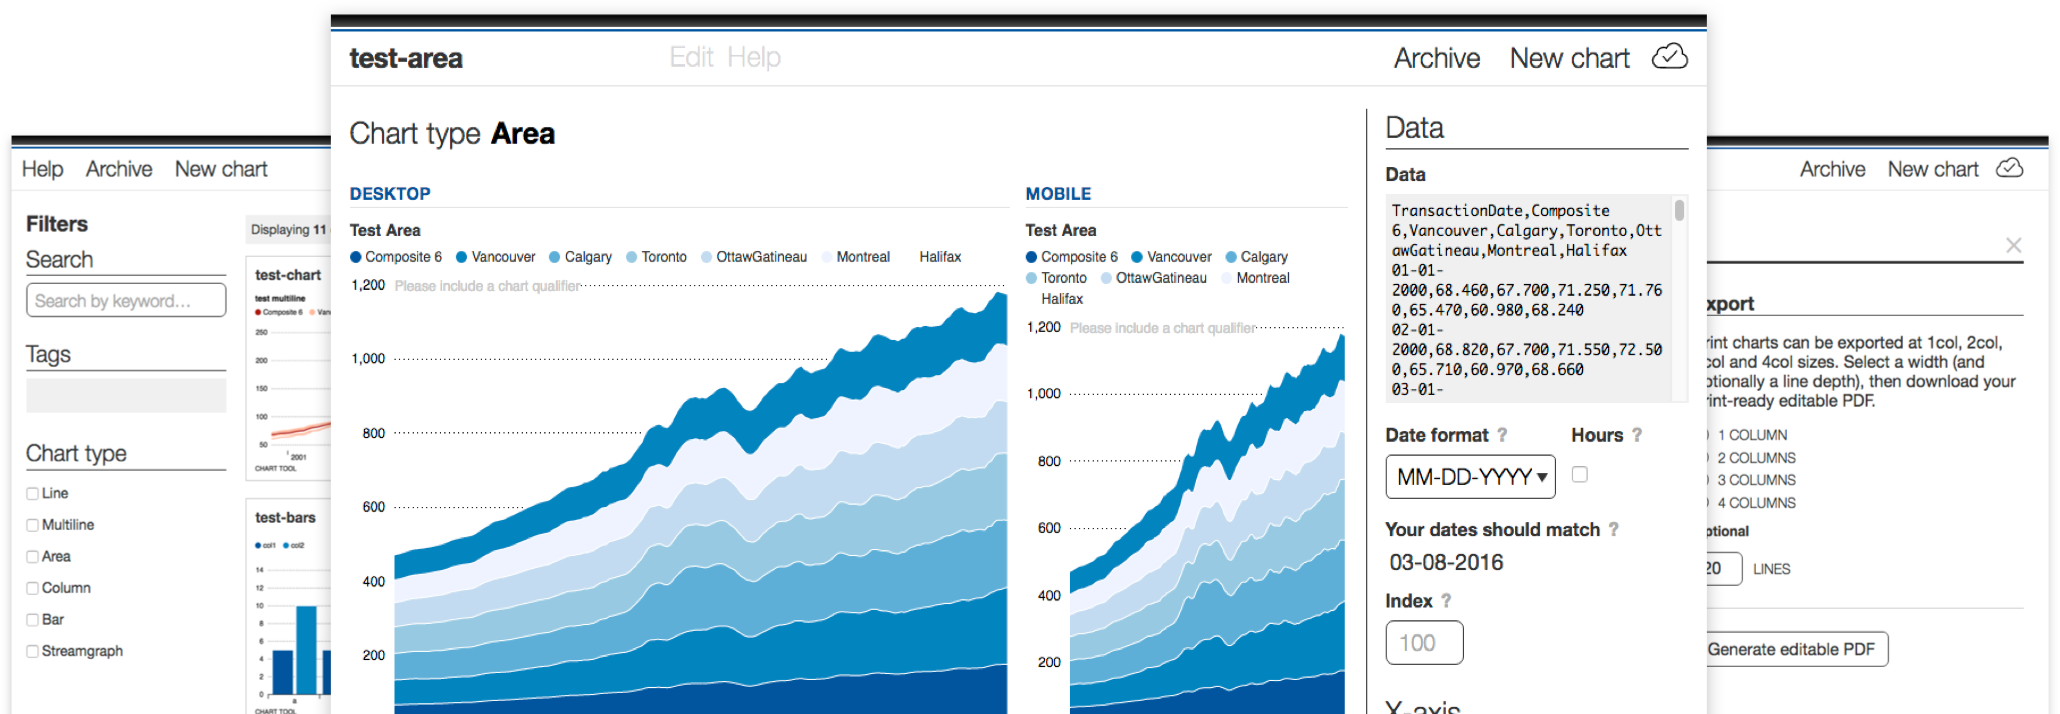
Chart Tool is a platform for creating beautiful charts in under a minute. Designed to fit the needs of a fast-paced mobile and print newsroom, Chart Tool generates responsive interactive charts for the web, JPGs and PNGs for social media and PDFs for print.
The first version of Chart Tool launched in The Globe and Mail’s newsroom in spring 2015. In under a year, reporters and editors have created more than 2000 charts using the tool.
The philosophy behind it was simple: it should be easy for anyone in the newsroom to create a great chart that just works — for every platform.
Chart Tool is made up of two parts:
A back-end interface for storing data, creating and exporting charts, and generating a static embed code, powered by Meteor. The embed codes are static by design — if your back end goes down, all the charts on your site will still display properly. Try out a demo of the charts interface.
A front-end JavaScript and CSS library that parses embed codes generated by the back-end and renders a responsive chart on your website using D3.js. The front-end library also offers an API that can be accessed to modify charts before or after they’ve been drawn.
Key Features
Simple, straightforward GUI: Easy-to-use graphical interface for editing charts. The interface is also collaborative: multiple people can work on the same chart at once
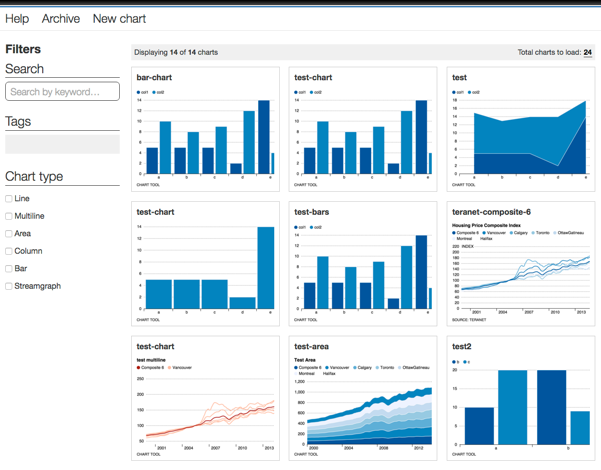
Searchable database: All charts are stored in a searchable, taggable database for easy retrieval
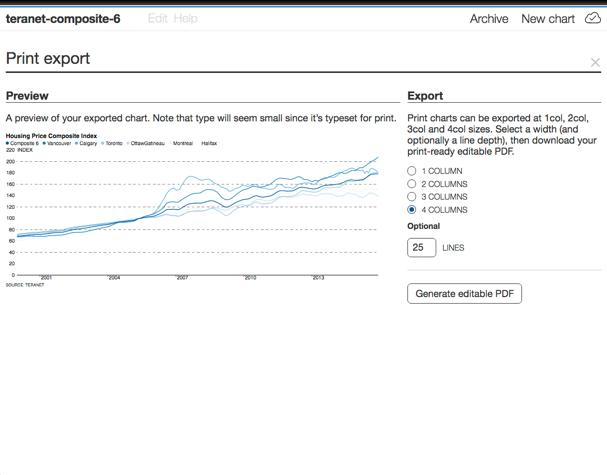
Asset generation: Easily generate PNGs at any size, or PDFs for print use
More Features
Fallback images: All charts come with a fallback image in case the library is unable to draw the chart. Fallbacks can be stored either on AWS, or inline base 64 images
Just one dependency: On the front end, Chart Tool’s library only dependency is D3.js
Pre- and post-render hooks: All charts come with several basic custom events via d3.dispatch, including pre- and post-render hooks for every chart
Debounced redraws: Charts will redraw automatically on window resize after a small period of time
Highly configurable: Don’t want tips to appear for a specific chart, or want to manually set the number of ticks to be displayed? No problem!
“Ordinal-time” scales: Treat time series data as if it were ordinal — this is very useful for visualizing stock price charts, or when you want to skip weekends and holidays
Examples
Line Charts
Multi-series Line Charts
Multi-series Column Chart
Stacked Column Chart
Area Chart
Stacked Area Chart
Bar Chart
Multi-series Bar Chart
Getting Started
For full installation instructions, check out our github repo.
Curious to try out Chart Tool, but don’t want to go through the process of setting it up? Try out our hosted demo version.
Quick start:
Ready to dive in? First, you’ll need Node.js >= 4.1.0 installed. We recommend using nvm to keep your Node version in sync with what Chart Tool expects. This is important: anything lower and Meteor will fail in spectacular and unexpected ways.
Next, you’ll need to install Meteor.
$ npm install -g gulp$ git clone git@github.com:globeandmail/chart-tool.git
$ cd chart-tool
$ npm install
After that, you’ll need to do the following to get Meteor running for the first time, which provisions the Mongo database and installs all the dependencies it’ll need (this might take a minute).
$ cd meteor && meteorOnce that’s done, you’re in business. Stop the Meteor server (CTRL-C on a Mac) and cd back to the parent directory.
$ gulpThat’s it! You’re running Chart Tool!
Now that you’ve got Chart Tool up and running, check out some tutorials. A great one to start on is Making your first chart.
SVG chart embeds
Once you’ve created a chart or two you’ll end up with some embed code to place in your articles. That embed code looks like this:
<!-- CHART TOOL v1.1.0-0 -->
<!-- edited: Tue Feb 23 2016 09:17:16 GMT-0500 (EST) -->
<!-- slug: test-bars -->
<div class="ct-chart" data-chartid="ct-PcCyQSEshJu8gNvAc">
  <script>
    (function(root) {
      var data = {
        "version": "1.1.0",
        "id": "PcCyQSEshJu8gNvAc",
        "heading": "",
        "qualifier": "",
        "source": "CHART TOOL",
        "chart": {
          "class": "primary",
          "hasHours": false,
          "data": "test,col1,col2\na,5,10\nb,5,8\nc,5,9\nd,2,12\ne,14,4",
          "x_axis": {
            "display": true,
            "scale": "linear",
            "ticks": "auto",
            "orient": "bottom",
            "format": "auto",
            "rescale": false,
            "nice": true
          },
          "y_axis": {
            "display": true,
            "scale": "ordinal",
            "ticks": "auto",
            "orient": "right",
            "format": "comma",
            "rescale": false,
            "nice": false
          },
          "options": {
            "type": "bar",
            "interpolation": false,
            "stacked": false,
            "expanded": false,
            "head": true,
            "deck": false,
            "legend": true,
            "footer": true,
            "x_axis": true,
            "y_axis": true,
            "tips": false,
            "annotations": false,
            "range": false,
            "series": false,
            "indexed": false,
            "qualifier": true,
            "share_data": true,
            "social": true
          }
        }
      };
      root.__charttool = root.__charttool || [];
      root.__charttool.push({id: 'ct-' + data.id, data: data});
    })(this);
  </script>

</div>
Combined with the Chart Tool front-end JavaScript and CSS libraries, the embed code above will become a fully responsive, interactive chart.
FAQ
Unlike most other charting applications out there, Chart Tool was designed from the ground up with fast-paced mobile and print newsrooms in mind. That means all charts are responsive, previously created charts are archived and searchable, the UI is simple and easy to teach to reporters and editors and charts can be downloaded as both social-ready PNGs and print CMS-ready PDFs. In the year since The Globe and Mail first deployed Chart Tool internally, we’ve logged over 2,000 charts in our database, and published thousands of charts in print and online. Still not convinced? Get in touch.
If you’re just looking to generate images of your charts, we’ve got you covered! Chart Tool is able to generate PNGs at any size you want right from the editing screen.
Any time-series or ordinal data can be visualized using chart types including line charts, multiline charts, area charts, stacked area charts, column charts, stacked column charts, horizontal bar charts and streamgraphs. Chart Tool also includes a special kind of time scale we call “ordinal-time”, which combines aspects of time-series and ordinal scales to create a chart that treats time-series data in an ordinal way — an ideal scale for visualizing data such as sequential stock market prices (say, from 9am to 5pm over a five day span) without breaks.
You should probably start with our Getting Started guide, which walks you through how to clone and install Chart Tool. Once that’s done, check out some of our tutorials for more information on how to set up automatic image backups, customize your charts, deploy your own copy to a server, and so on.
Easy enough that The Globe and Mail’s own fork of Chart Tool uses only customization options made available in the project’s custom folder.
The best way to help is by submitting an issue or sending us a pull request. If you’re interested in getting involved beyond basic features and bug fixes, shoot us a note — we’d love to chat.